This sample project demonstrates IQ's capability to integrating CYME database, process the data and generating distribution system models seamlessly. Results presented here provide a comparison between CYME and IQ to validate the results generated by IQ.
Project Description
The system under study in this example is composed of 5 feeders connected to a substation. The system raw data was exported from CYME as CYME ASCII files including Equipment, Network, and Load ASCII files. The files were then imported into IQ. Tables below summarize system characteristics.
Substation Transformer Peak Load (kW) | 21,185 |
|---|---|
Number of Feeders Served from this Bus | 5 |
Substation Transformer Summer Normal Rating (kVA) | 26,000 |
Supply Voltage (kV) | 69 |
Generation: Total , Connected, Queued Ahead (kW) | 25,606; 9,084; 14,522 |
Daytime Light Load (kW) | 6,361 |
A new PV system was proposed to interconnect to one of the feeders, called "interconnection feeder" in this project. Table below lists the interconnection feeder information.
Interconnection Feeder Peak Load (kW) | 4,191 |
|---|---|
Zero Sequence Impedance at POI | 1.93058+j4.26557 pu |
Positive Sequence Impedance at POI | 0.66867+j2.04634 pu |
Line to Ground Fault Current at POI | 1,470 A |
3-Phase Fault Current at POI | 2,044 A |
Generation on Interconnection Feeder: Total, Connected, Queued Ahead(kW) | 2,230; 208; 22 |
Line Phasing at POI | 3 |
Interconnection Feeder Primary Voltage at POI (kV) | 13.2 |
Interconnection Feeder Daytime Light Load (kW) | 1,221 |
The CYME model of the system didn't converge when a simple power flow analysis was performed in CYME. This is situation is very common when dealing with distribution system data. Often the data is incomplete, erroneous, or previously altered manually. When adding a new element to the model, the changes in the model may not follow a consistent format across the utility company. Those inconsistencies can also cause divergence in power flow analysis. When integrating CYME data into IQ, the data will be processed and all of the data inconsistencies, errors, and other issues will be fixed automatically and the models will be converged in power flow analysis.
System Modeling with IQ
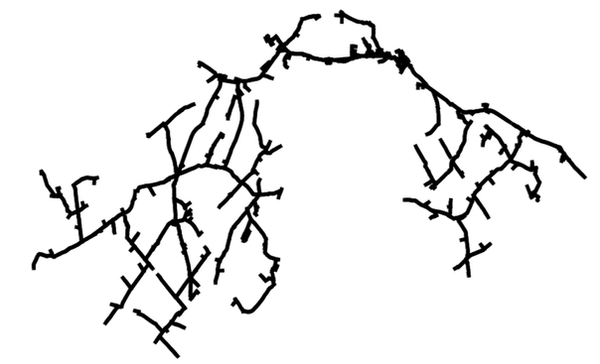
The CYME ASCII files were integrated into the IQ database. Upon the integration, the substation and all feeders models were automatically generated. The system layout generated by IQ is shown here.
A log file is generated when data is processed by IQ. The log file details all the corrections and data cleansing actions applied to the raw data. In this specific example, the nominal values of multiple circuit components didn't match the segment voltage level. In addition to the nominal value mismatch, the phasing sequence of multiple components didn't match the phasing of the segment. Table below lists voltage levels and configuration of the entire system established by IQ.
Feeder | Voltage Level | Configuration |
|---|---|---|
All Feeders | 0.6, 0.8, 4.16, 4.8, 13.2, 69 | Wye, Delta, Wye, Delta, Wye, Delta |
Interconnecting Feeder | 0.6, 0.8, 4.8, 13.2 | Wye, Delta, Delta, Wye |
Power Flow Analysis with IQ
After generating the system models, multiple power flow analysis was performed by IQ to validate the generated models. The image below shows a snapshot of IQ's power flow analysis engine for a peak load scenario including all DERs at their 100% generation capacity.

Power flow analysis for the peak load scenario was successfully converged and below are some of the power flow results generated by IQ. The maximum current, normal and emergency ratings, kW and kVar delivered, and number of customers connected to each segment are listed in Device Capacity Report snapshot. The phase magnitude and angle for each bus are shown in Bus Voltage Report snapshot.
Device Capacity Report

Bus Voltage Report

Fault Analysis with IQ
A fault analysis was performed in IQ by applying 3-phase and single-phase fault at all buses of the system. The fault values at the secondary of the substation transformer matches the results in ASPEN.
Fault Location | LLL | LG |
|---|---|---|
Secondary of Substation Transformer | 5,820 A | 6,404 A |
POI | 2,044 A | 1,470 A |
The sequence impedance seen from the POI is an important factor for interconnecting new DER unites, specially the electronically coupled technologies such as PV and energy storage.
Sequence Impedance | Value Calculated in IQ |
|---|---|
Z0 (100 MVA Base) | 4.258 pu |
Z1 ( 100 MVA Base) | 2.112 pu |
Another important factor when interconnecting a new DER is protection coordination between the new DER and the upstream protective device. Therefore, it is important to detect the upstream protective device and its TCC curve accurately in order to evaluate the impact of the new DER protective devices on the upstream protection scheme. In this project, IQ detected a recloser upstream of POI. Figure below shows the protective curve of the upstream recloser.

TCC Curve of the Upstream Recloser